
Running Training Zones: A Detailed Guide
The use of training intensity zones for running is a well-established method of planning training.
Since there’s a relationship between the intensity of training and certain adaptations that are important for performance, the ability to plan workouts using a common intensity-based language and system, as well as to track the time spent in each zone, can help bring important structure to a training program.
In this guide, we’ll lay out the most commonly used and “logical” methods of delineating training intensities and discuss the associated benefits and potential drawbacks for each method. Along the way, we’ll also provide some practical advice to help you understand whether you’re training in the right zones.
There are more training zone systems in existence than covered in this guide. However, we have tried to only include those that we feel are most intuitive, science-based and importantly, effective for runners. There are numerous other systems that we feel are needlessly confusing and thus are not discussed or recommended here.
The zoning systems we’ve chosen to talk about are:
The seven zone model
The three zone model
Seven-Zone Model
The seven zone model presented below is adapted from the system originally proposed by Andrew Coggan and colleagues in the context of cycling. We like this system because it provides a practical level of granularity - the zones are specific enough to capture meaningfully different training intensities, but not so specific that the zones are narrow and hard to stay within. We also like that this system is tied to different training ‘goals’ (e.g. ‘recovery’), which helps to make it clear what each intensity zone seeks to achieve.

Table 1: Running Training Zones. Note that the heart rate targets for Zone 2 runs can be fine-tuned according to the ‘talk test’ protocol described below. The upper end of Zone 4 and the lower end of Zone 5 are also best set using max heart rate, rather than threshold heart rate, in our view.
If you’re unsure on how to determine your threshold heart rate, max heart rate, or what Stryd critical power is, we’ll explain this further below, along with some nuances of this zoning system.
However, first, we wanted to go into little more detail about the purpose of each zone…
Zone 1
This is the active recovery zone and is mainly used for regenerative purposes more so than for inducing a training stress, though very long durations spent in Zone 1 will indeed promote ‘peripheral’ adaptations at the muscles, such as increases in mitochondrial content and capillary density around the slow twitch (Type I) muscle fibres. This in turn helps improve the body’s capacity for aerobic metabolism and ability to use fat as the primary fuel source.
A typical application of Zone 1 is during active recovery runs and walks of 20-60 minutes. These can be used 2-3 times per week to facilitate recovery between harder training days.
Zone 1 can also be used between work intervals in higher intensity interval workouts to aid in the clearance of lactate and associated fatiguing metabolites. For example, an interval session might alternate between 3-mins at a Zone 5 intensity and 3-mins at a Zone 1 intensity.
Zone 2
This is the zone you’ll usually be aiming to accumulate the most training time in. It’s an intensity that’s sustainable for hours at a time, and is also thought by many academics and coaches to be optimal for stimulating peripheral adaptations at the muscles, such as increased mitochondrial and capillary density, and improvements in lactate transporters (Seiler & Tønnessen, 2009).
Zone 2 is also specifically at an intensity where fat oxidation rates are maximised, and it’s been suggested that this intensity is optimal for developing fat oxidation capacity (Jeukendrup & Achten, 2001). Fat oxidation capacity is a key determinant of the lactate threshold in running, as well as fatigue-resistance, since better fat oxidation capacity helps preserve the body’s limited stock of glycogen.
Zone 3
The ‘Intensive Aerobic’ zone is still an intensity that promotes aerobic adaptations. However, the intensity is slightly higher than Zone 2 and should therefore generally be used sparingly as it can cause substantially more metabolic and mechanical stress (i.e. through elevated levels of fatiguing metabolites, higher levels of muscle glycogen depletion, and higher levels of loading on muscles and tendons).
A main purpose of this zone is to recruit additional muscle fibres that are not usually recruited in a Zone 2 run until the latter stages, and to stimulate aerobic adaptations within these lesser-recruited fibres, which are predominantly of Type IIa.
In endurance events, these Type IIa fibres become particularly important later on in a race, as the more aerobically efficient Type I fibres fatigue and pass over work to the Type IIa fibres. Zone 3 training can therefore help with muscular endurance (i.e. ability to sustain power/pace below threshold without a concurrent increase in heart rate/oxygen demand), by making the Type IIa fibres more aerobically efficient.
Zone 3 training can also help increase the lactate threshold by reducing lactate production within Type IIa fibres and generally contributing to improved aerobic fitness and VO2max.
Zone 3 can be structured into intervals or used for the duration of a full run, depending on ability level.
Zone 4
Zone 4 training is carried out very close to the lactate threshold, which is the maximum pace, power or heart rate that can be maintained while lactate levels in the blood remain at a stable level (for more on the lactate threshold, which is also referred to as the maximum lactate steady state, see here).
Training close to the lactate threshold is somewhat controversial, with potentially as many advocates as there are opponents. This zone sits right at the point where the rate of lactate production begins to exceed the rate of lactate clearance, meaning the concentration of lactate and associated fatiguing metabolites increases rapidly beyond this zone.
The purpose of working in Zone 4 is often to improve the muscle’s ability to ‘shuttle’ (i.e. move) lactate away from the working muscles and to other parts of the body where it can be oxidised to produce energy. This in turn contributes to an improvement in lactate threshold power/pace. However, it’s worth noting that there is some evidence that training right at the threshold isn’t the best way to improve threshold power/pace (Billat et al., 2004). Indeed, training at at a Zone 4 intensity may be more beneficial for improving tolerance to riding at a moderately hard intensity for extended periods of time, rather than improving threshold speed.
Intervals in this zone will typically last between 6-minutes to 40-minutes, although 40-mins at Zone 4 would be a very hard (race-like) session and wouldn’t generally be used frequently.
Zone 5
Zone 5 is designed to be at an intensity that elicits ‘VO2max’ - or in other words the maximal rate of oxygen uptake and utilisation. It’s thought that training close to VO2max can help develop this important fitness attribute.
More specifically, while VO2max can be limited by a number of factors (see here), the main adaptation that Zone 5 training is thought to elicit is an increase in the heart’s ‘stroke volume’ (Helgerud et al., 2007). Or in other words, an increase in the amount of blood (and thus oxygen) the heart can pump per beat.
Zone 5 training probably also contributes to an improvement in mitochondrial efficiency, which is another factor influencing VO2max (Bishop et al., 2014).
Intervals in Zone 5 will typically last between 2 to 6 minutes, although they may last longer if oscillating/adjustable pace/power is used. An example of this would be intervals where the pace is adjusted to keep heart rate within 5-10% of maximum heart rate. In this scenario, running pace may intermittently fall below an athlete’s threshold pace (on flat and stable terrain), and then increase again as heart rate begins to drop.
We have an article on VO2max training here, if you want to learn more.
Zone 6
Training in Zone 6 can be used to increase ‘anaerobic power’, or in other words the ability to produce energy quickly via anaerobic energy pathways.
Zone 6 training specifically helps develop the ability to break down carbohydrates quickly in a process known as glycolysis, as well as the ability to recruit Type IIx (the highest-power muscle fibres) and tap into greater stores of ‘phosphocreatine’, which is a source of anaerobic energy. You can learn more about these different energy systems in this article.
Depending on the structuring of intervals, Zone 6 training can also be used to improve ‘anaerobic stamina’, which is the length of time an effort can be sustained above the lactate threshold.
Ultimately, Zone 6 training can help to give more punch over efforts lasting ~10-120 seconds, and a better ability to repeat these efforts time and again within a race.
Intervals within this zone typically last between 20-120 seconds, with recovery intervals ranging from 1-mins to 6-mins, depending on the specific structure and goal of the session.
Zone 7
Zone 7 or the neuromuscular zone includes very short efforts (<10-15 seconds), which are designed to activate all (or nearly all) muscle fibres. Rather than training a specific energy system, these sessions mainly help forge neural connections to muscle fibres so that you become better able to activate them in subsequent training or racing.
In practice, Zone 7 training contributes to improved anaerobic power, particularly over very short durations (e.g. 10-seconds or less).
Important Points
First and foremost, it’s worth noting that the heart rate and power zones are based on population averages. The optimal zones for each person will vary based on individual physiology, and may not align perfectly with the targets shown in the table above.
In our view, it’s important to pay close attention to your perceived effort and breathing rate, as these arguably provide the most valid and reliable indicator of how hard you’re working. These can be interpreted alongside measures of heart rate (and optionally also power) in order to best understand the zone you’re training in. For example, if your heart rate is in Zone 2, but your breathing and perception of effort tell you you’re in Zone 3, then you may need to adjust your heart rate zones slightly.
Since Zone 2 training will make up the majority of training time for most runners, we’d even suggest performing a talk test (as described below), to help set the upper end of your Zone 2 heart rate more accurately, rather than using a basic percentage of threshold heart rate.
Likewise, for the boundary between Zones 4 and 5, we find that using 90% of max heart rate is a more physiologically-valid cut-point than a percentage of threshold heart rate. This is because percent of max heart rate tracks quite closely with oxygen consumption, and 90% of max heart rate corresponds to approximately 80-90% of VO2max (Swain et al., 1994). Since a primary focus of Zone 5 training is to spend time training close to VO2max, it makes sense to use percent of max heart rate to gauge this, given its close relationship with oxygen consumption!
It might be noticed that the table does not include running pace zones. This is because pace is almost meaningless for trail, mountain and fell running. Even if you run according to a grade adjusted pace (i.e. pace adjusted to account for gradient), this doesn’t account for things like mud, uneven and technical terrain and wind speed, which can all contribute significantly to the internal stress of running at a particular pace.
It’s also worth noting that there won’t be a perfect 1:1 correspondence between heart rate and power zones. Again, this is because the target percentages are based on population averages, and won’t be perfectly correct at an individual level. This is another reason why it’s important to pay close attention to perceived effort and breathing, as well as how sustainable an effort feels. For power in particular, we prefer to avoid setting any power zones at all with an athlete initially, and instead ask the athlete to perform a variety of training sessions based on feel and heart rate. This will then give us relevant information to help set more individualised power training zones according to what’s actually achievable for that athlete.
For example, a classic Zone 5 training session would be 5x 5-min efforts with 3-4-mins recovery. So we might ask an athlete to complete this session, aiming to pace the efforts consistently, and finish feeling like the effort is hard, but that there is probably another half-effort in reserve. Then we could look at the power the athlete held in these intervals, and this would give us a good idea of where that athlete’s Zone 5 power range sits.
Finally, one misconception that we’d like to dispel relates to tracking time in zone using heart rate. As most people will be acutely aware, when you begin running, you can be working hard but your heart rate can take some time to rise. This heart rate lag is perfectly normal, and doesn’t negate the fact that you’re still working e.g. in Zone 4+, even though heart rate may only be within Zones 2 or 3. The muscles are still demanding oxygen at a high rate, burning substrates such as glycogen and phosphocreatine, and utilising a high proportion of muscle fibres, even though heart rate has not yet had chance to rise.
Indeed, in the case of Zone 6 or 7 intervals, the efforts might be so short that you never even see heart rate rise above Zones 3 or 4. This doesn’t mean that you’re not spending time in your target training zones. For this reason, when you come to reviewing your training, and looking to see how much time you spent running in a particular zone, we wouldn’t recommend using heart rate to evaluate this!
Testing Protocols
If you want to use heart rate or power to pace your efforts, then you’ll need to do some testing to establish some key physiological anchor points: threshold heart rate, max heart rate and critical power. We’ll explain each of these terms below, and outline protocols to help you establish them.
Threshold Heart Rate
Your threshold heart rate is the heart rate you reach and maintain when running at your ‘lactate threshold’. We have a full article on what the lactate threshold is and how it can be trained here, but in brief, it’s the maximum intensity at which lactate levels remain stable, and for most runners is an intensity that can be maintained for approximately 40 to 60 minutes.
The best way to determine your threshold heart rate would be to race at a steady pace for roughly 40-60 minutes and take your average heart rate from this effort.
However, a quicker and more reproducible method involves the following:
PRE-TEST REQUIREMENTS:
A Garmin watch/similar that can record time, pace and heart rate, and has a lap function. Make sure you have your watch set up so that you can see elapsed lap time, pace and heart rate.
Ideally a heart rate chest or upper-arm strap. If you only have a heart rate monitor on your wrist watch, that will be less reliable but is ok if it’s all you have. In this case, you should make sure that your watch is done up tightly to minimise movement of the optical heart rate sensor on your wrist, and improve the quality of your heart rate data.
Somewhere flat that you can run continuously for 30 minutes.
TEST PROTOCOL:

Warm up for 10-20 minutes running at an effort level that feels subjectively easy and where breathing is conversational. Towards the end of this warm-up include some short surges or strides, accelerating to a higher speed to elevate heart rate and breathing rate, and activate higher-power muscle fibres. A good tip is to keep an eye on your heart rate during this warm up to make sure your heart rate monitor is reading values that seem reliable. If not, you might need to moisten and/or reposition your heart rate strap.
Next, perform a 30-minute time trial, aiming to pace this effort consistently so that you’re not slowing down or speeding up notably between the beginning and the end. This test is best done on a flat, smooth surface so that you’re not being slowed by technical terrain, and so that you can also measure your pace during this effort (which will help you gauge improvements in your lactate threshold pace).
After the first 10-minutes of the time trial, press the lap button on your watch. This will help you isolate the right segment of the run in your analysis later…
After you’ve completed the full 30-minutes, press the lap button again, and then cool down at a subjectively easy pace for ~5-10 minutes at least.
Your threshold heart rate can be calculated as 95% of your average heart rate for the final 20-mins of your 30-min time trial. So for example, if your average heart rate for the 20-mins was 170bpm, then your threshold heart rate would be 0.95 x 170 = 162bpm.
You can also make a note of the pace you held for the full 30-min time trial. This will give an indication of how your threshold pace (which will be slightly slower than the 30-min time trial pace) changes from one test to the next.
Your threshold heart rate will change as your fitness changes, and we’d therefore recommend assessing your threshold heart rate every 8-12 weeks on average.
Max Heart Rate
Many readers will be familiar with the often-cited equation of 220 minus age to determine maximum heart rate. However, this equation is very inaccurate on an individual level. Therefore to work out your maximum heart rate you can follow the protocol below:
PRE-TEST REQUIREMENTS:
A Garmin watch/similar that can record time, pace and heart rate, and has a lap function. Make sure you have your watch set up so that you can see elapsed lap time, pace and heart rate.
Ideally a heart rate chest or upper-arm strap. If you only have a heart rate monitor on your wrist watch, that will be less reliable but is ok if it’s all you have. In this case, you should make sure that your watch is done up tightly to minimise movement of the optical heart rate sensor on your wrist, and improve the quality of your heart rate data.
Somewhere that you can run continuously for roughly 15 minutes (the effort can be done on the flat or a shallow-moderate gradient, but try to avoid any down-hill).
TEST PROTOCOL:

Warm up for 10-20 minutes running at an effort level that feels subjectively easy and where breathing is conversational. Towards the end of this warm-up include some short surges or strides, accelerating to a higher speed to elevate heart rate and breathing rate, and activate higher-power muscle fibres. A good tip is to keep an eye on your heart rate during this warm up to make sure your heart rate monitor is reading values that seem reliable. If not, you might need to moisten and/or reposition your heart rate strap.
Then run moderately hard (7-8/10 effort - targeting Zone 4-5) for 10- minutes.
Immediately after this 10-minute effort, ramp the intensity up to complete a maximal 1 minute effort, finishing with a 20 to 30 second sprint.
Cool down gradually for a further 10-15 minutes after this maximal effort is complete.
Your max heart rate can be set as the peak heart rate reached towards the end of the 1-min effort.
It’s worth noting that if you’ve done a race where you finished with a very hard effort similar to what’s described above (e.g. roughly 1-min running all-out), then you could also use heart rate data from that race to set your max heart rate.
Your max heart rate will be quite stable, and does not change in response to training. However, it will decline a little as you get older. For this reason, we’d recommend reassessing your max heart rate every 1 year. Each time you reassess, you might want to perform the test a few times (on separate days), since your ability to reach your true max heart rate will vary from day to day based on things like motivation, fatigue, stress and so on.
Critical Power
Critical power is a well-established concept describing the relationship between power and the length of time that particular power output can be sustained.
The basic premise of this test is that power output above a certain ‘critical power’ follows a hyperbolic power-duration curve as shown below.

The curve can be defined by two parameters: the critical power (CP) and W’ (pronounced as ‘W prime’).
CP is the power output that you’ll fall towards when riding at a high intensity as exercise duration is increased ‘indefinitely’ (‘indefinitely’ is a mathematical construct, and not actually true in practice, which is why this power-duration model fails to hold at or below CP). In practice, people can typically only sustain power outputs at CP for around 30-minutes (Vanhatalo et al., 2011).
CP occurs at around the lactate threshold (Dearing & Paton, 2022), and can therefore be used to set training zones and gauge intensity in a similar way to threshold heart rate. The key benefit to running with power though, is that changes in intensity can be detected within 10-seconds, which is far more responsive than heart rate.
W’ (measured in kJ – i.e. units of energy) is the amount of work that can be done above the CP, and is a marker of anaerobic capacity. Runners with a bigger W’ tend to be punchier and better able to respond to changes in pace.
By performing a series of maximal tests (we recommend doing 3 maximal efforts, each lasting between 3-30 minutes), it is possible to determine CP and W’ from the power-duration relationship. The maths behind these calculations are beyond the scope of this article. Indeed most Stryd users will just follow the testing protocol recommended by Stryd, and will simply use the critical power generated by the Stryd algorithms, which have been shown to have good agreement with other more traditional (and scientifically validated) methods (Dearing & Paton, 2022).
The Stryd test protocol is as follows:
A long maximal effort or race lasting between 40–60 minutes (recommended for anyone training for half marathon distances or longer).
A medium maximal effort or race of 10–20 minutes.
A short maximal effort of 3–5 minutes.
A set of short sprints lasting 10–30 seconds
With the exception of the sprints, all other efforts should be performed on different days, when feeling relatively well-rested and well fuelled. The sprints can be included before any of the other efforts. Ideally, testing is performed over 1-3 weeks, so that the results aren’t skewed by changes in fitness over the testing period.
It’s also possible to just perform efforts (2) and (3) an input your results into a critical power calculator like this one. This has the benefit that you can also predict your performance over efforts lasting 3-mins to 20-mins using this calculator.
Talk Test
Another test that you may wish to incorporate is a so-called ‘talk test’. This can be used to gain more accuracy in where the top end of your Zone 2 heart rate sits, since this can vary quite a lot depending on things like your ability to use fats for fuel and running economy. This test is also a good way of assessing improvements in these key running abilities, which collectively contribute greatly to your endurance/fatigue-resistance over multiple hours.
The talk test is specifically designed to determine your ‘ventilatory threshold’, which is the point where you see marked up-tick in your breathing rate. This is caused by a shift in substrate utilisation, away from fat oxidation and towards carbohydrate oxidation, which results in higher levels of carbon dioxide production and an increased rate of breathing. It’s an important physiological tipping point that demarcates the boundary between Zones 2 and 3.
We can detect this ventilatory threshold using the protocol described in this article.
Three Zone Model
We’ll next take a look at an alternative training zone scheme, which has only three intensity zones.
This is perhaps the simplest yet one of the most physiologically and scientifically grounded training intensity zone system. It’s sometimes referred to as ‘polarised’ or ’80/20’ model.
This system is used by several national federations and coaches, and is well supported in the scientific literature. Unlike the previous model, where some of the zone boundaries are somewhat arbitrary, the three zone model is based on two real physiological cut-points, defining specific metabolic conditions within the body.
These cut-points are either the first and second ventilatory thresholds or the first and second lactate thresholds, depending on the specific testing protocol used. The ‘ventilatory’ thresholds are determined based on breathing rate and/or the amounts of carbon dioxide and oxygen in expired air, and the ‘lactate’ thresholds are determined based on the levels of lactate in the blood.
Here’s what this model looks like, including the “VT” (ventilatory thresholds) and “LT” (lactate thresholds), which define the boundaries of each zone:
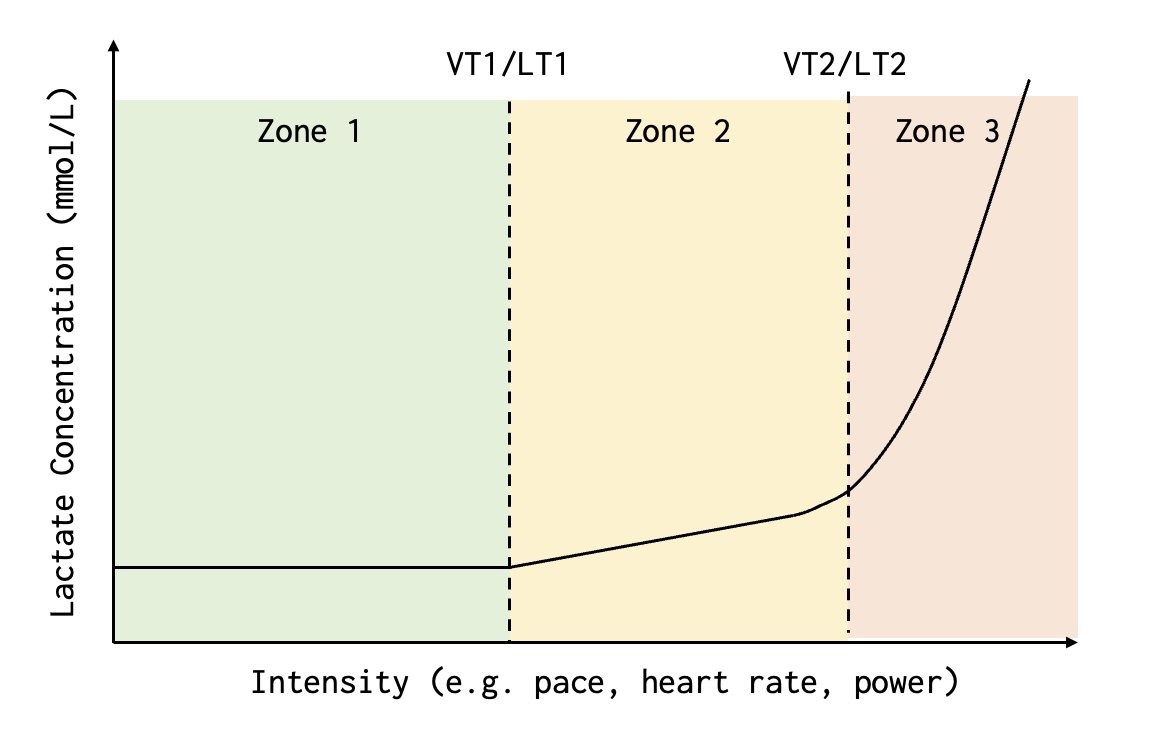
These cut-points can be established from lab testing (by measuring expired air or taking lactate samples during one or more exercise tests). The specific locations of the cut-points depend on the testing protocol used, and there are lots!
You might have noticed that previously in this article, we referred to the ‘lactate threshold’, and now we’re referring to ‘first’ and ‘second’ lactate thresholds. For the avoidance of doubt, when we and most others refer simply to the ‘lactate threshold’, we’re describing LT2 in the graph above.
But let’s delve a little more into what these thresholds mean…
In general, the lower cut-point is intended to capture the workload at which lactate levels become substantively elevated above resting levels, and the ratio of expired gas to oxygen consumption swings upwards, reflecting an increased contribution to energy production from glycolysis (i.e. carbohydrate combustion). Above LT1/VT1, but below LT2/VT2, blood lactate levels can still be maintained in a steady state, but are higher than they would be when resting.
The upper cut point (LT2/VT2) then broadly reflects the point at which blood lactate levels can no-longer be maintained in a steady state, and begin to accumulate rapidly even when power is held constant. This is referred to as the ‘maximum lactate steady state’, or sometimes just the ‘lactate threshold’. Around this point, the ratio of expired air to expired CO2 swings upwards again. This reflects the point at which the aerobic energy system can no longer match energy demand. You can read more about this second threshold here.
These cut points have been shown to correlate well with other physiological inflection points, such as muscle activation (assessed via EMG), and catecholamine levels (reflective of how stressful exercise might be) (Seiler & Kjerland, 2006), further supporting the physiological meaningfulness of this model.
If you don’t have access to a lab, you can determine the top end of Zone 1 by performing a talk test, as described above, and the top end of your Zone 2 can be set using the threshold heart rate test.
Many coaches and top-level runners support use of a so-called ‘polarised’ or 80/20 model of training, where the majority of training time is spent in Zones 1 and 3 of a three-zone model, with only a minimal amount of training in Zone 2 (e.g. 75% of sessions in Zone 1, 5% in Zone 2 and 20% in Zone 3).
A key limitation of the three zone model is that there is no differentiation within the three, fairly broad levels. So it’s hard to say where, for example, to pitch training to develop the anaerobic power versus training to develop the aerobic capacity. This is where the seven-zone model can be helpful.
Final Points
One outstanding question we haven’t yet addressed is whether you actually need to use training zones. They are helpful, but balanced training can be achieved without them. Simply performing different maximal efforts over a variety of different durations on a routine basis can give you a good idea of what you can achieve and you can use this to establish what feels generally “easy”, “medium” or “hard”, and how well you can recover from these different intensities and thus how often to incorporate them within a plan. Overall though, we feel that the use of training zones is a useful tool to help design training and to understand the likely physiological impacts of a particular training session.
References
Allen, H., Coggan, A. R., & McGregor, S. (2019). Training and racing with a power meter. VeloPress.
Billat, V., Sirvent, P., Lepretre, P. M., & Koralsztein, J. P. (2004). Training effect on performance, substrate balance and blood lactate concentration at maximal lactate steady state in master endurance- runners. Pflügers Archiv, 447(6), 875-883.
Bishop, D. J., Granata, C., & Eynon, N. (2014). Can we optimise the exercise training prescription to maximise improvements in mitochondria function and content?. Biochimica et Biophysica Acta (BBA)-General Subjects, 1840(4), 1266-1275. Some relationship to lactate clearance?
Cerezuela-Espejo, V., Courel-Ibáñez, J., Morán-Navarro, R., Martínez-Cava, A., & Pallarés, J. G. (2018). The relationship between lactate and ventilatory thresholds in runners: Validity and reliability of exercise test performance parameters. Frontiers in physiology, 9, 1320.
Dearing, C. G., & Paton, C. D. (2022). Is Stryd critical power a meaningful parameter for runners?. Biology of Sport, 40(3), 657-664.
Helgerud, J., Høydal, K., Wang, E., Karlsen, T., Berg, P., Bjerkaas, M., ... & Hoff, J. (2007). Aerobic high-intensity intervals improve V ̇ O2max more than moderate training. Medicine & Science in Sports & Exercise, 39(4), 665-671.
Jeukendrup, A., & Achten, J. (2001). Fatmax: A new concept to optimize fat oxidation during exercise?. European Journal of Sport Science, 1(5), 1-5.
Seiler, K. S., & Kjerland, G. Ø. (2006). Quantifying training intensity distribution in elite endurance athletes: is there evidence for an “optimal” distribution?. Scandinavian journal of medicine & science in sports, 16(1), 49-56.
Seiler, S., & Tønnessen, E. (2009). Intervals, thresholds, and long slow distance: the role of intensity and duration in endurance training. Sportscience, 13.
Swain, D. P., Abernathy, K. S., Smith, C. S., Lee, S. J., & Bunn, S. A. (1994). Target heart rates for the development of cardiorespiratory fitness. Medicine and science in sports and exercise, 26(1), 112-116.
Vanhatalo, A., Jones, A. M., & Burnley, M. (2011). Application of critical power in sport. International journal of sports physiology and performance, 6(1), 128-136.